9.3 Reducing Background
A characteristic seen in Figures 9.3 is that the daily data across small- and large-scale bioreactors are shifted on the intensity axis where they tend to trend down for higher wavelengths. For spectroscopy data, intensity deviations from zero are called baseline drift and are generally due to noise in the measurement system, interference, or fluorescence (Rinnan, Van Den Berg, and Engelsen 2009) and are not due to the actual chemical substance of the sample. Baseline drift is a major contributor to measurement variation; for the small-scale bioreactors in Figure 9.3 the vertical variation is much greater than variation due to peaks in the spectra which are likely to be associated with amount of the glucose molecule. The excess variation due to spurious sources that contribute to background can have a detrimental impact on models like principle component regression and partial least squares which are driven by predictor variation.
For this type of data, if background was completely eliminated, then intensities would be zero for wavenumbers that had no response to the molecules present in the sample. While specific steps can be taken during the measurement process to reduce noise, interference and fluorescence, it is almost impossible to experimentally remove all background. Therefore, the background patterns must be approximated and this approximation must be removed from the observed intensities.
A simple and clever way to approximate the background is to use a polynomial fit to the lowest intensity values across the spectrum. An algorithm for this process is:
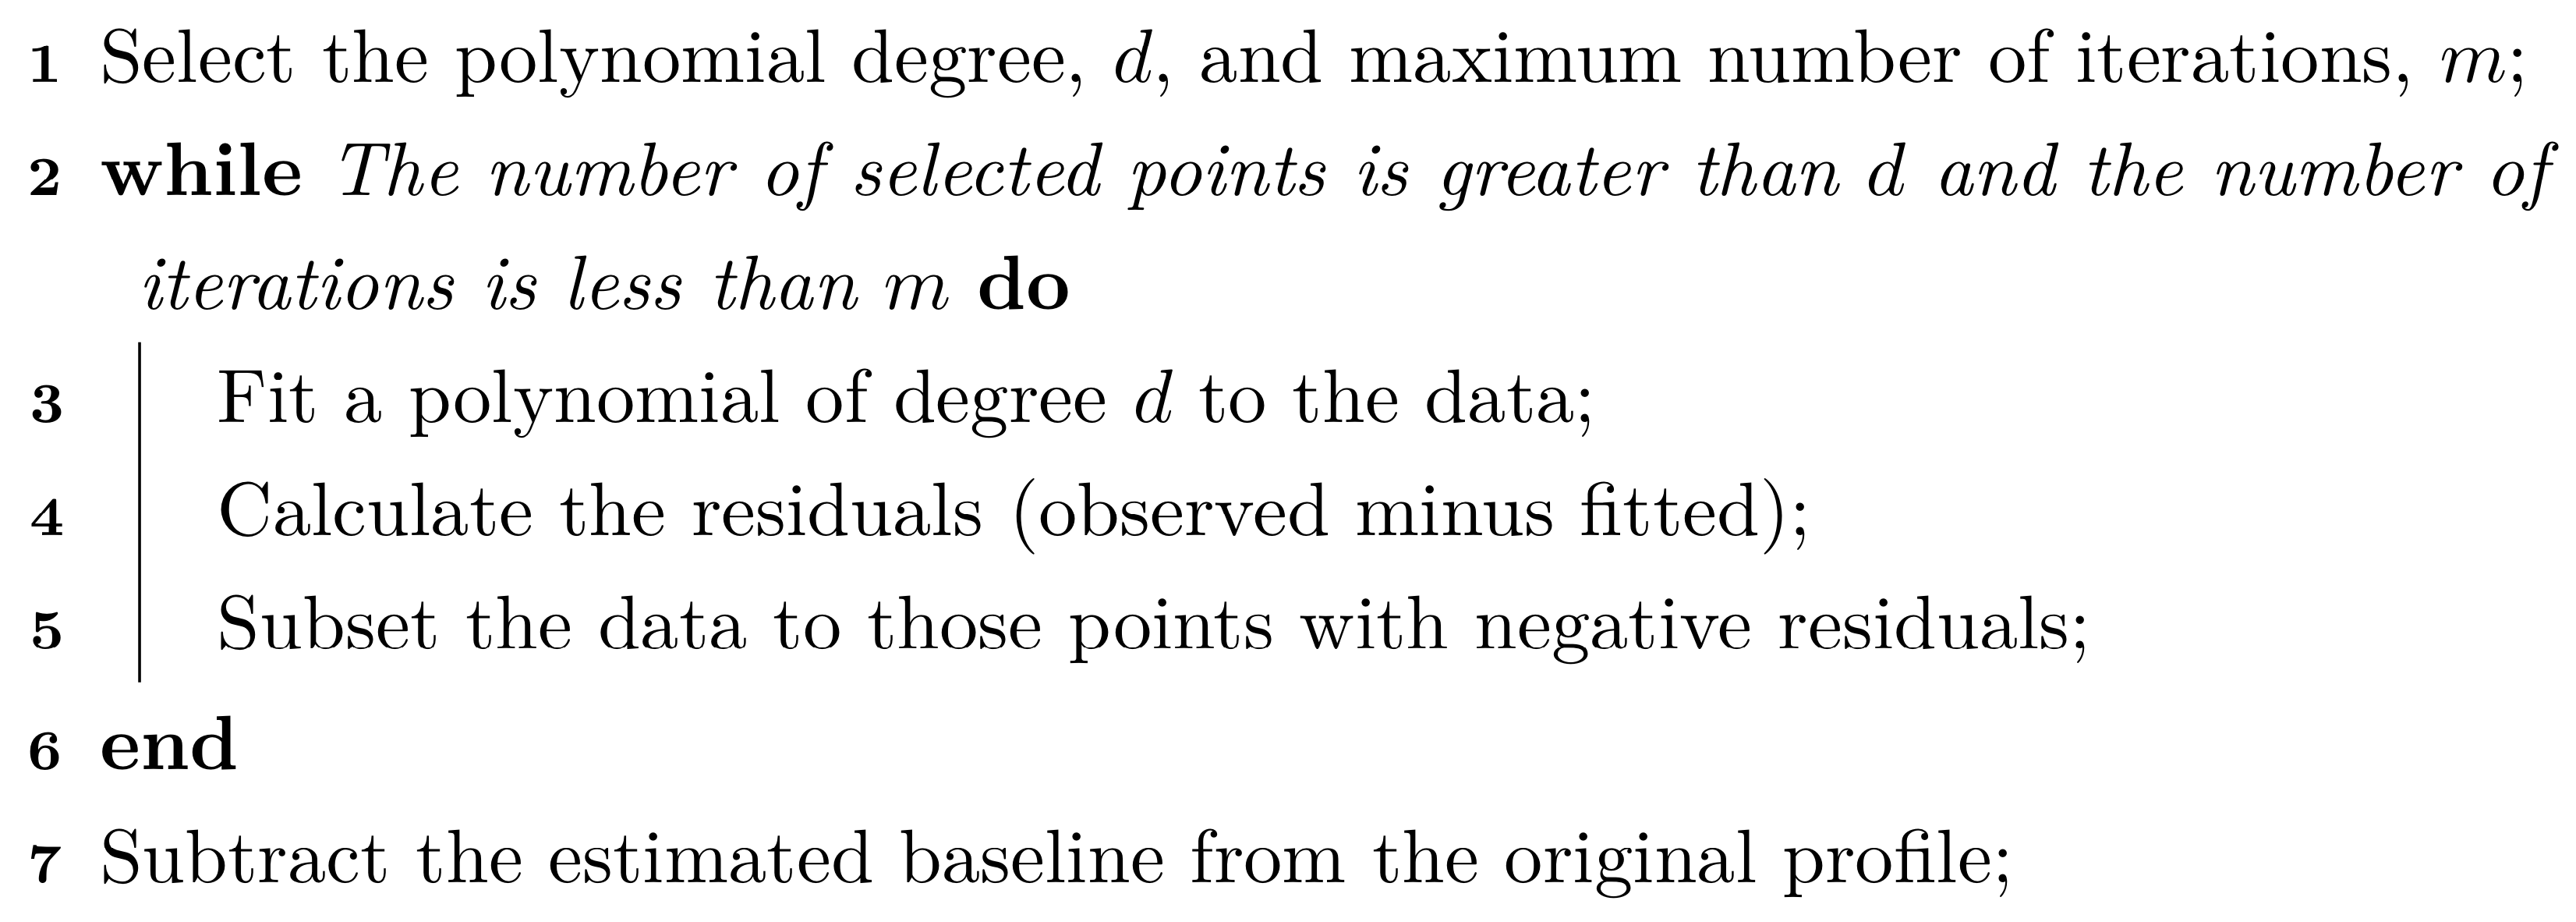
For most data, a polynomial of degrees 3 to 5 for approximating the baseline is usually sufficient.
Figure 9.5 illustrates the original spectra, a final polynomial fit of degree \(d = 5\), and the corrected intensities across wavelengths. While there are still areas of the spectra that are above zero, the spectra have been warped so that low-intensity regions are near zero.

Figure 9.5: A polynomial baseline correction for the small-scale bioreactor 1, day 1 intensities.