9.1 Illustrative Data: Pharmaceutical Manufacturing Monitoring
Pharmaceutical companies use spectroscopy measurements to assess critical process parameters during the manufacturing of a biological drug (Berry et al. 2015). Models built on this process can be used with real-time data to recommend changes that can increase product yield. In the example that follows, Raman spectroscopy was used to generate the data77 (Hammes 2005). To manufacture the drug being used for this example, a specific type of protein is required and that protein can be created by a particular type of cell. A batch of cells are seeded into a bioreactor which is a device that is designed to help grow and maintain the cells. In production, a large bioreactor would be about 2000 liters and is used to make large quantities of proteins in about two weeks.
Many factors can affect product yield. For example, because the cells are living, working organisms, they need the right temperature and sufficient food (glucose) to generate drug product. During the course of their work, the cells also produce waste (ammonia). Too much of the waste product can kill the cells and reduce the overall product yield. Typically key attributes like glucose and ammonia are monitored daily to ensure that the cells are in optimal production conditions. Samples are collected and off-line measurements are made for these key attributes. If the measurements indicate a potential problem, the manufacturing scientists overseeing the process can tweak the contents of the bioreactor to optimize the conditions for the cells.
One issue is that conventional methods for measuring glucose and ammonia are time consuming and the results may not come in time to address any issues. Spectroscopy is a potentially faster method of obtaining these results if an effective model can be used to take the results of the spectroscopy assay to make predictions on the substances of interest (i.e., glucose and ammonia).
However, it is not feasible to do experiments using many large-scale bioreactors. Two parallel experimental systems were used:
- 15 small-scale (5 liters) bioreactors were seeded with cell and were monitored daily for 14 days.
- Three large-scale bioreactors were also seeded with cells from the same batch and monitored daily for 14 days
Samples were collected each day from all bioreactors and glucose was measured using both spectroscopy and the traditional manner. Figure 9.2 illustrates the design for this experiment. The goal would be to create models on the data from the more numerous small-scale bioreactors and then evaluate if these results can accurately predict what is happening in the large-scale bioreactors.
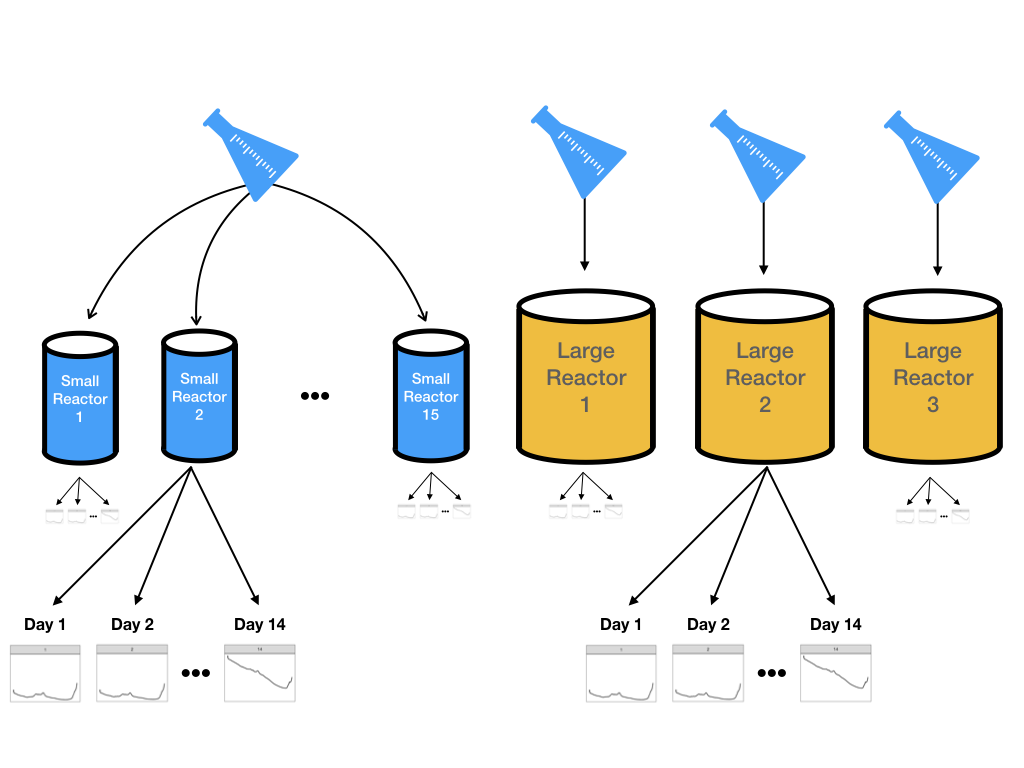
Figure 9.2: A schematic for the experimental design for pharmaceutical manufacturing.
The spectra for several days within one small and one large-scale bioreactor are illustrated in Figure 9.3(a). These spectra exhibit similar patterns in the profiles with notable peaks occurring in similar wavelength regions across days. The heights of the intensities, however, vary within the small-scale and between the small- and large-scales. To get a sense for how the spectra change over the two-week period, examine Figure 9.3(b). Most of the profiles have similar overall patterns across the wavenumbers, with increasing intensity across time. This same pattern is true for the other bioreactors, with additional shifts in intensity that are unique to each bioreactor.


Figure 9.3: (a) Spectra for a small- and large-scale reactor on days 1, 7, and 14. (b) The spectra for a single reactor over 14 days.
The data used in this illustration was generated from real data, but has been distinctly modified to preserve confidentiality and achieve illustration purposes.↩